
File:Bitcoin-vs-ftt-performance-week-nov-2022.png
Original file (1,200 × 675 pixels, file size: 324 KB, MIME type: image/png)
Summary
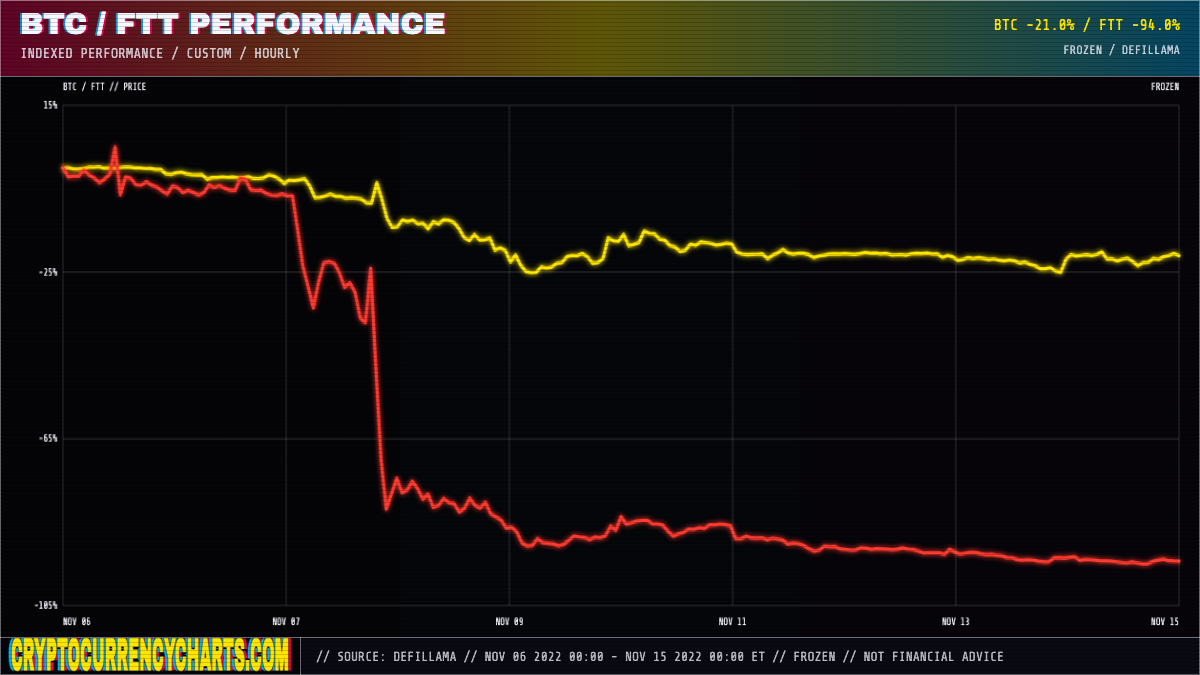
Indexed percentage-performance chart comparing bitcoin (BTC) and FTX's own exchange token (FTT) during the week of the FTX collapse, November 6-15, 2022. Both assets are indexed to their November 6, 2022 starting price so the chart shows percentage change rather than raw dollar price. Bitcoin fell from a high near $21,300 on November 6 to a low near $15,900 on November 9, a decline of about 25 percent. Over the same window, FTT fell from a high near $24.75 on November 6 to a low of $1.27 on November 14, a decline of roughly 95 percent. FTT's much steeper collapse reflects Alameda Research's balance sheet being heavily dependent on the token; when that exposure became public and a rival exchange announced it would sell its FTT holdings, the token cratered far faster than the broader cryptocurrency market. This chart is used on Sam Bankman-Fried.
Source
Chart generated by cryptocurrencycharts.com from public cryptocurrency market data (DefiLlama). The interactive, source-attributed version of this exact chart is available at cryptocurrencycharts.com.
Licensing
This image was generated by cryptocurrencycharts.com using publicly available cryptocurrency market-price data. It is not a copyrighted photograph, artwork, or trademarked logo. It is used on Prisonpedia with the chart creator's permission for editorial and reference purposes.
File history
Click on a date/time to view the file as it appeared at that time.
| Date/Time | Thumbnail | Dimensions | User | Comment | |
|---|---|---|---|---|---|
| current | 19:38, 15 July 2026 | Error creating thumbnail: Unable to save thumbnail to destination | 1,200 × 675 (324 KB) | Orderly (talk | contribs) | Add FTT-vs-BTC indexed performance chart (FTX collapse week, Nov 6-15 2022) |
You cannot overwrite this file.
File usage
The following page uses this file:
