
File:Bitcoin-ftx-collapse-week-nov-2022.png
Original file (1,200 × 675 pixels, file size: 297 KB, MIME type: image/png)
Summary
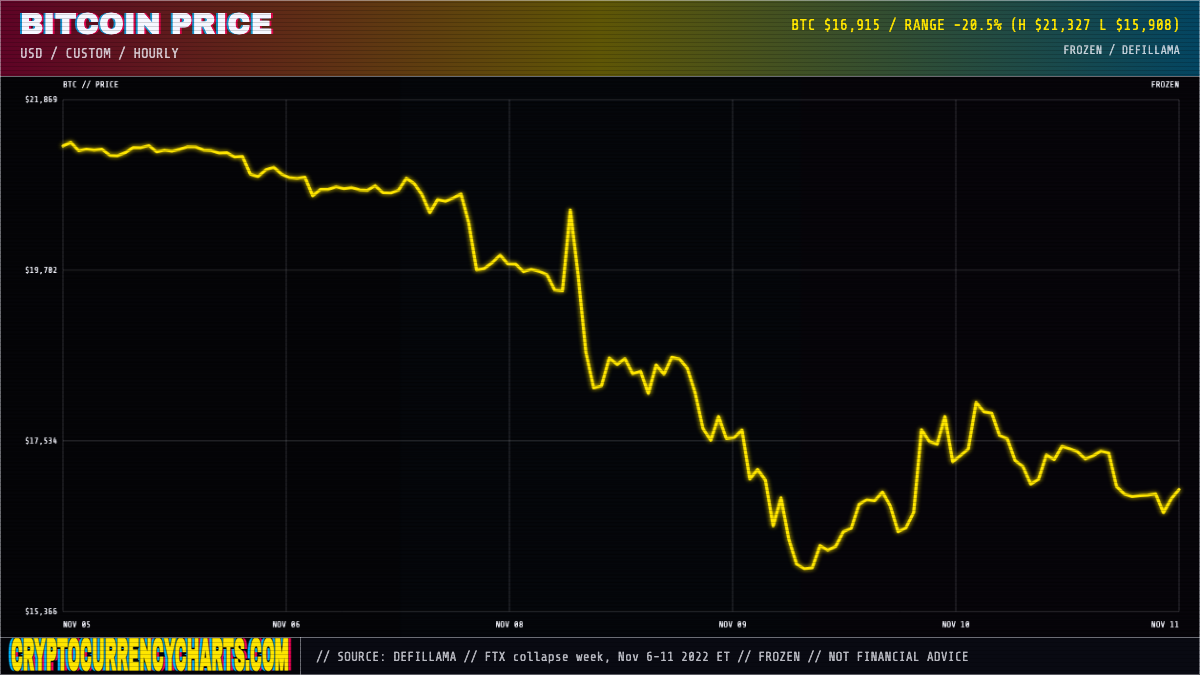
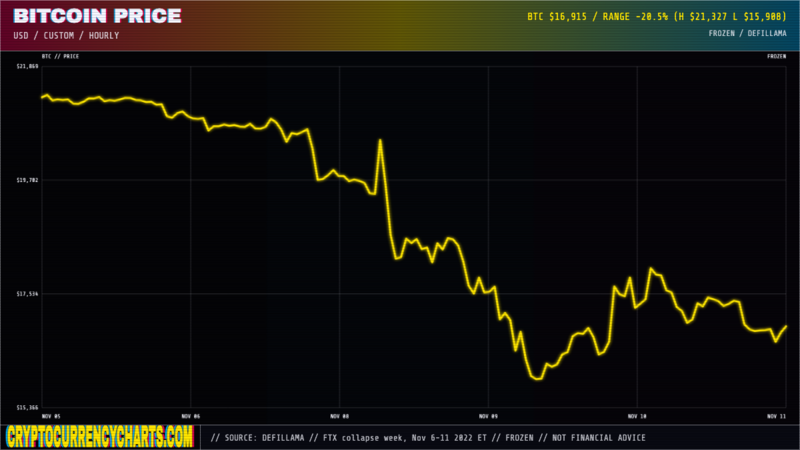
Bitcoin (BTC/USD) price chart for the week of the FTX collapse, November 6-11, 2022. Bitcoin fell from a high near $21,300 on November 6 to a low near $15,900 on November 9, 2022, a decline of about 25 percent, as customers rushed to withdraw funds from FTX and the exchange filed for bankruptcy on November 11, 2022. This chart is used on Nishad Singh to give the FTX collapse market context.
Source
Chart generated by cryptocurrencycharts.com from public cryptocurrency market data. The interactive, source-attributed version of this exact chart is available at cryptocurrencycharts.com.
Licensing
This image was generated by cryptocurrencycharts.com using publicly available cryptocurrency market-price data. It is not a copyrighted photograph, artwork, or trademarked logo. It is used on Prisonpedia with the chart creator's permission for editorial and reference purposes.
File history
Click on a date/time to view the file as it appeared at that time.
| Date/Time | Thumbnail | Dimensions | User | Comment | |
|---|---|---|---|---|---|
| current | 19:32, 15 July 2026 | | 1,200 × 675 (297 KB) | Orderly (talk | contribs) | == Summary == Fix: remove live-quote header from historical FTX-collapse-week chart (2026-07-15) |
| 18:59, 15 July 2026 | 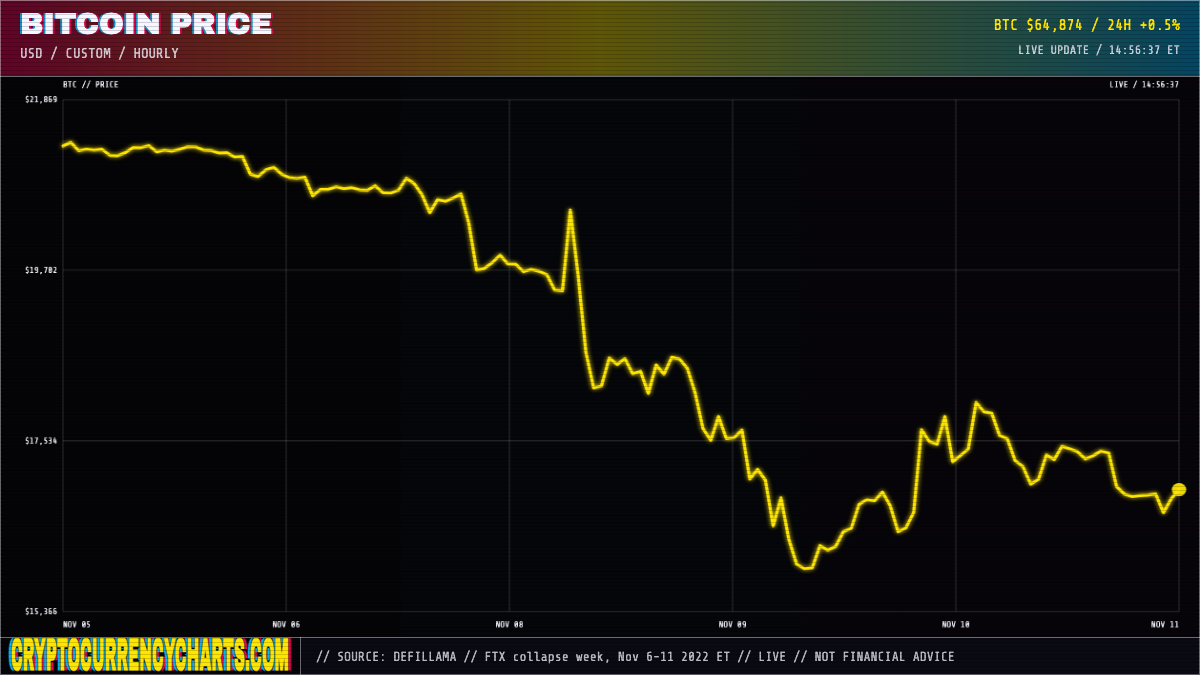 | 1,200 × 675 (295 KB) | Orderly (talk | contribs) | Branded export replacing unbranded placeholder | |
| 18:32, 15 July 2026 | 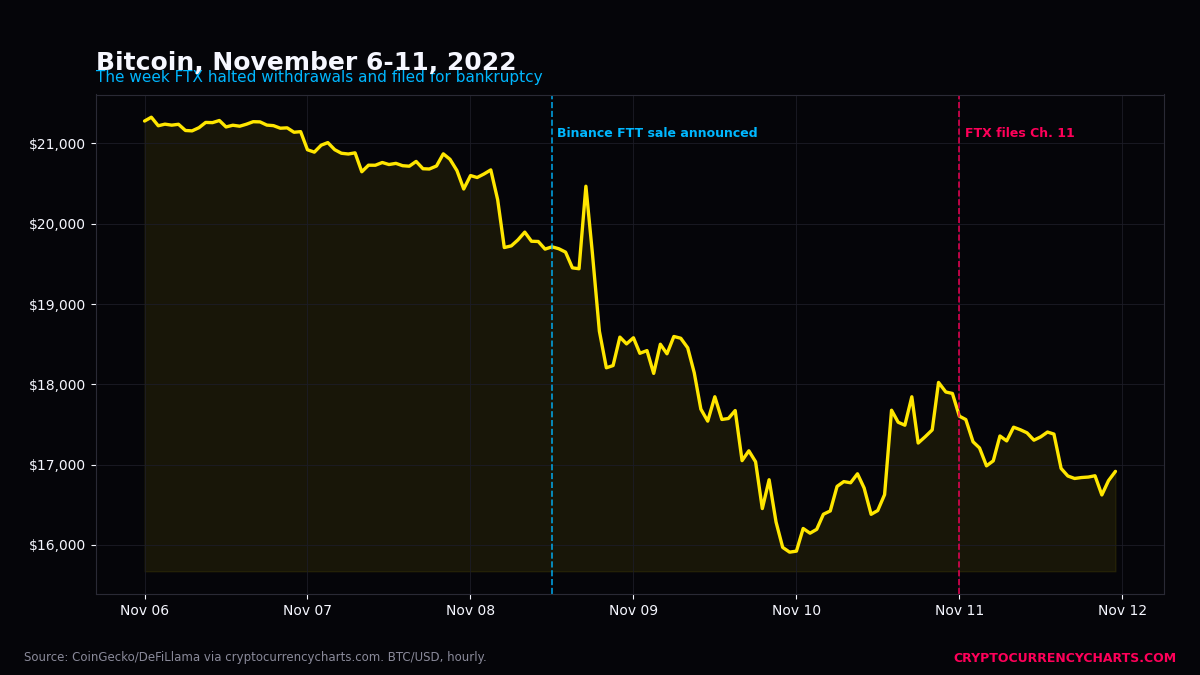 | 1,200 × 675 (71 KB) | Orderly (talk | contribs) | FTX collapse week BTC chart, source cryptocurrencycharts.com |
You cannot overwrite this file.
File usage
The following page uses this file:
